Tampilkan postingan dengan label glucose management. Tampilkan semua postingan

Senin, 16 Mei 2016

High Dose Caffeine Restores Insulin Sensitivity and Limits Total as Well as Visceral Fat Gain Due to High Sugar Diets

Yes, the study at hand is on caffeine, but the results are relevant for coffee, too.
A decade ago, the medical community though coffee would dehydrate you, would make you insulin resistant and would increase your risk of heart disease. Recent studies show that coffee does not negatively affect your hydration status (Killer. 2014), that higher coffee consumption is associated with reduced diabetes risk and increasing your coffee consumption can reduce your risk of T2DM (Akash. 2014) and that a "daily intake of ∼2 to 3 cups of coffee appears to be safe and is associated with neutral to beneficial effects" on coronary heart disease, congestive heart failure, arrhythmias, and stroke (O'Keefe. 2013).

Against that background it may not be as surprising as it would have been 10 years ago that Joana C. Coelho, et al. (2016) found caffeine to be able to restores insulin sensitivity and glucose tolerance in high-sucrose diet rats. And yet, I personally believe that it is still worth pointing out the results of this study as the high sucrose diet the mice were fed is the same "high sugar diet" about which you will read all over the news that it is to blame for the obesity and diabetes epidemic.
You can learn more about coffee and caffeine at the SuppVersity

For Caffeine, Timing Matters! 45 Min or More?

Coffee - The Good, Bad & Interesting

Three Cups of Coffee Keep Insulin At Bay

Caffeine's Effect on Testosterone, Estrogen & SHBG

The Coffee³ Ad- vantage: Fat loss, Appetite & Mood

Caffeine Resis- tance - Does It Even Exist?
Against that background, it is particularly interesting to take a closer look at the data from Coelho's study, because it is the first to actually provide a valid explanation for the observed improvements in glucose sensitivity in response to the ingestion of caffeine.
Figure 1: 16-wk food intake, weight gain, fat gain and visceral fat gain according to caffeine intake (Coelho. 2016).
Now, the bad news is that significant effects were only observed for the highest dose of caffeine, ie..e 1g/L drinking water. That appears to be ridiculously high, but is in fact only "very high". If you do take into consideration that a wistar rat consumes only 100 ml/kg body weight per day, that's a dosage equivalent of 100 mg/kg for a rodent and thus ~16 mg/kg for a human being or ~6-7 cups of coffee (over a 24h period).
University of Memphis: Caffeine can help control the increase in blood lipids and oxidation after inhaling (10 minutes) a high calorie + high fat milk shake, controlled trial involving twelve healthy men shows (Crone. 2016).
Yes, the dosage is high, but actually less may have more benefits, and...  the most relevant benefits (reduced fat gain) were seen at a dosage that would be equivalent to only 4-5 cups of coffee, which happens to be roughly what epidemiological studies show to be in the zone of maximal benefits. Don't mistake this as a recommendation to guzzle liters of coffee, though... and that even if another recent study shows that 400mg of caffeine will lower the fatty acid onslaught and oxidation 12 men experience after consuming a large high fat milk-shake (Crone. 2016)... and speaking of coffee: you may also want to make sure to get a dark roast, because the latter has just been found to improve glucose metabolism and redox balance even if it is low in caffeine (Di Girolamo. 2016). 
While I am not sure how healthy the chronic consumption of these amounts of caffeine actually is. I am aware of several people who get their 6-7 cups of regular coffee per day and are in perfect health. With that being said, the latter may be at least partly due to the the highly beneficial effects of caffeine on the expression of glucose transporter 4 (GLUT4) and insulin receptor expression and phosphorylation (not shown in Figure 2) in the visceral fat depots of coffee connaisseurs.
Figure 2: Effects of different doses of caffeine on GLUT4 and insulin receptor expression in rats (Coelho. 2016).
The above elevations were accompanied by profound increases in protein kinase B (Akt) expression and activity, as well - an observation the scientists regard as being evidence of the fact that "[c]hronic caffeine administration improved whole-body glucose homeostasis and insulin signaling pathways in adipose tissue" (Coelho. 2016).

This conclusion cannot be questioned. What can be questioned, though, is the scientists assumption that this would occur only with high doses of caffeine and in response to increases in GLUT4 and insulin receptor expression in the visceral fat. Why's that? Well take a look at the figure in the bottom line: it shows that significant improvements in glycemia were improved at all dosages. The latter wouldn't have been possible if the lower dosages wouldn't have had an effect on glucose uptake, as well. Whether that's an effect in muscle cells (which would be great), needs further investigation. The previously discussed effects of caffeine on muscle glycogen storage (learn more), on the other hand, would suggest just that: an effect on skeletal muscle, and or a reduction in gluconeogenesis which could, among other things, be triggered by coffee's / caffeine's ability to inhibit the reactivation of glucocorticoids by 11β-hydroxysteroid dehydrogenase type 1" (Atanasov. 2006).
As you can see sign. improvements in glycemia occured even with the lowest amount of caffeine in the drinking water. And that in spite of the fact that the GLUT4 and insulin receptor levels in the visceral fat did not increase significantly... well, maybe those in the rodents' muscle did?
Bottom line: I am not suggesting that the rodent study at hand would provide enough evidence to suggest that everyone should drink at least 4 cups of high caffeine coffee per day. What I do suggest, however, is that the study at hand provides more evidence on potential mechanisms that explain why coffee drinkers are plagued less often by metabolic disease.

With that being said, I would like to remind you that the abuse of caffeine to combat a lack of sleep and/or overtraining may make you dig a deep black hole out of which you will be able to crawl only within weeks of abstinence... and I am talking about abstinence from caffeine and exercise, assuming that it was the combination of both that got your into trouble | Comment on Facebook!
References:
  • Akash, Muhammad Sajid Hamid, Kanwal Rehman, and Shuqing Chen. "Effects of coffee on type 2 diabetes mellitus." Nutrition 30.7 (2014): 755-763.
  • Atanasov, Atanas G., et al. "Coffee inhibits the reactivation of glucocorticoids by 11β-hydroxysteroid dehydrogenase type 1: A glucocorticoid connection in the anti-diabetic action of coffee?." FEBS letters 580.17 (2006): 4081-4085.
  • Coelho, Joana C., et al. "Caffeine Restores Insulin Sensitivity and Glucose tolerance in High-sucrose Diet Rats: Effects on Adipose Tissue."
  • Crone, et al. "Impact of Meal Ingestion Rate and Caffeine Coingestion on Postprandial Lipemia and Oxidative Stress Following High-Fat Meal Consumption." Journal of Caffeine Research (2016): Ahead of print. DOI: 10.1089/jcr.2016.0004.
  • Di Girolamo, Filippo Giorgio, et al. "Roasting intensity of naturally low-caffeine Laurina coffee modulates glucose metabolism and redox balance in humans." Nutrition (2016).
  • Killer, Sophie C., Andrew K. Blannin, and Asker E. Jeukendrup. "No evidence of dehydration with moderate daily coffee intake: a counterbalanced cross-over study in a free-living population." PloS one 9.1 (2014): e84154.
  • O'Keefe, James H., et al. "Effects of habitual coffee consumption on cardiometabolic disease, cardiovascular health, and all-cause mortality." Journal of the American College of Cardiology 62.12 (2013): 1043-1051.

Selasa, 26 April 2016

Baking Bread With ~100g Extra-Fat Reduces the Glycemic Response: Coconut Oil Beats Butter, Grapeseed & Olive Oil

No, adding fat to your bread's dough won't make you lose fat magically.
While fat no longer has the bad rep it still had a decade ago, the notion that baking bread with extra fat could have anti-diabetic effects, because it reduces the glucose peaks and the 2h area under the curve (AUC) is unconventional, to say the least; and thus SuppVersity news-worthy, because it is not broscience, but the result of a recent study.

In said study, the scientists tested (a) the effect of different types of fat / oil on the formation of amylose–lipid complexes (ALC) and, more importantly, (b) the effect of the ALCs on the glycemic response to a standardized amount of bread that was baked with the same amount of different fats / oils.
Don't forget that health and looking good naked require eating right and working out!

Exercise Research Uptake Nov '14 1/2

Exercise Research Uptake Nov '14 2/2

Weight Loss Supplements Exposed

Exercise Supplementation Quickie

Squat 4 Min B4 Workout, Chains & Bands + More

Read the Latest Ex. Science Update
The study was an acute, randomised, controlled, single-blinded trial that consisted of five types of bread, each tested on one occasion in a randomised order on separate days, with at least 3 washout days between test visits.
"Participants were recruited through advertisements and personal communications. Inclusion criteria were as follows: (1) males aged between 21 and 50 years, (2) BMI values between 18·0 and 24·9 kg/m2, (3) blood pressure≤120/80 mg/dl and (4) fasting blood glucose≤6·0 mmol/l. People who had metabolic diseases, were on prescribed medication, were smokers, took part in sports at competitive levels or were concurrently participating in other clinical trials were excluded from the study. Females were excluded from the study to prevent differences in menstrual cycles from affecting carbohydrate metabolism" (Lau. 2016).
On the day before a test session, no drinks, caffeine or physical activity were allowed. In addition, a standardised dinner was provided the evening before to reduce potential variations in GR that may arise because of the second meal effect. On the day after, participants had to report to the centre after a 10–12 h fast between 08.00 and 09.00 hours. There, they rested for at least 15 min before starting the test session, before the test meal was consumed "at a comfortable pace within 15 min" (Lau. 2016). Following consumption of test bread, participants were asked to rate their liking of the bread on a 100-mm liking scale. Blood samples (both venous and capillary) were collected at 15, 30, 45, 60, 90, 120, 150 and 180 min after test bread consumption. The same protocol was repeated until the completion of all the five test sessions.
Serving size, energy content and macronutrient composition of the test breads (per serving | Lau. 2016)
How was the bread prepared? This is what the scientists report: "The five types of bread used were as follows: control bread without any added fats (CTR) and breads baked with butter (BTR), coconut oil (COC), grapeseed oil (GRP) or olive oil (OLV). The ingredients used for test breads were as follows: 250 g bread flour (Prima), 125 g potable water, 10 g baker’s yeast (SAF), 40 g sugar (Fairprice) and 6 g salt (Fairprice). These ingredients were mixed at speed 1 for 8 min (Kitchenaid) to form base dough, of which 320 g was weighed and then fat/oil was added.

The fats/oils added were 96 g butter that contained predominantly SFA (Anchor), 87 g coconut oil that was rich in medium-chain TAG (Titi Ecofarm), 80 g grapeseed oil containing predominantly PUFA (Borges) and 76 g olive oil containing predominantly MUFA (Naturel). The amount of fats/oils added was calculated based on the percentage fat as stated on the nutritional panel on the packaging, and was added at 20 %, w/w of dough. Oil was not added into the control bread. The dough mixture was kneaded for a further 12 min, and was then allowed to rest at room temperature for 10 min. Following this, the dough was moulded into serving portions and proofed in the oven (EOB98000; Electrolux) at 40±1°C for 30 min in a fan-assisted mode. Baking was carried out in the same oven at 200°C for 18 min, and bread was allowed to stand for 10 min before being served warm" (Lau. 2016).
The results of the scientists' analysis of the ALC formation in the bread showed that the coconut (COC) and olive oil (OLV) had significantly higher amylose–lipid complex forming ability [reported wrong in the result section of the FT, but correct in the discussion] as compared with butter (BTR) and grapeseed oil (GRP | P<0·05).
Figure 1: Complexing index results for different types of bread. Values are means (n 6), with standard errors represented by vertical bars. a,b Mean values with unlike letters were significantly different (P < 0·05; one-way ANOVA with post hoc Tukey’s test). BTR = butter; COC = coconut oil; GRP = grapeseed oil; OLV = olive oil (Lau. 2016).
Interestingly, the increased ALC levels in the olive oil bread did not produce the same beneficial effects on the glucose response the scientists observed when the subjects consumed the bread that was baked with coconut oil.
Figure 2: (a) Postprandial response curves for change in blood glucose and (b) plasma insulin levels after consumption of 50 g available carbohydrate portion of test bread. Values are means (n 15), with standard errors represented by vertical bars. For glucose response, there were significant time (P < 0·001), bread (P < 0·001) and bread×time interaction effects (P=0·002) when analysed by two-way, repeated-measures ANOVA. For insulin response, two-way, repeated-measures ANOVA showed a significant time effect (P < 0·001) and bread×time interaction effect at near significant levels (P=0·074), but no effect of bread was seen (P=0·195). open circle, Control bread without oil; filled circle, bread with butter; open triangle, bread with coconut oil; filled triangle, bread with grapeseed oil; open square, bread with olive oil (Lau. 2016).
As you can see in Figure 2, all fat-enhanced breads improved the glycemia, but only the grapeseed (closed triangle) and coconut (open triangle) oils also rduced the insulin levels.
Can't I just add the coconut oil on top of the bread? No, you can't, because it has to be in the dough during baking - otherwise the amylose–lipid complexes won't form. What will happen though is that your insulin levels will rise sign. longer (see previous SV article). Edit: Elizabeth Alcott just posted this cool suggestion on Facebook: "Bake low carb coconut flour bread with coconut oil. Reduced calories and glycemic response at the same time." Not a bad idea, for sure.
What is interesting to see, though, is that the glucose AUC, i.e. the total amount of glucose that is released into the blood was still the lowest in those oils / fats with the highest ALC levels: coconut oil and olive oil.
Figure 3: Postprandial glycaemic and insulinaemic responses (AUCs for 180min) after consumption of test bread (Mean values with their standard errors for fifteen healthy young men | Lau. 2016)
As the authors point out in the discussion of the results of their study, their regression analysis "further confirmed that CI [=indicator of ALC formation] was a significant predictor of GR [glucose response], although it only accounted for 13·3 % of the observed variability" (Lau. 2016). Furthermore, the scientists highlight that ...
"[w]hen examined as IAUC, COC showed the greatest attenuation of GR [glucose response] in baked bread. A similar study by Clegg et al. (2012) showed that high-fat pancakes containing MCT had the slowest gastric emptying rate as compared with other fats/oils over a 4-h period. The low GR [glucose response] of COC in this study could be due to a combination of factors. These include delay in gastric emptying rates to MCT having a higher osmolarity (Clegg. 2012) and formation of ALC resulting in resistant starch (Kaur. 2000)" (Lau. 2016).
To assess the physiological significance of these observations, Lau et al. also investigated the surrogate measures of postprandial β-cell function (IGI30 and IGR) and the insulin response which did - in contrast to the glucose response (see Figure 3), not correlate with the ALC content of the breads. Instead, it appeared to be "partially due to rate of appearance of glucose as a result of carbohydrate digestibility" (Lau. 2016).
Will the additional butter on top of the potatoes reduce the insulin response? You can find the answer to this and the other questions in today's episode of "True or False?" | learn more!
So, what's the verdict? Well, adding ~25g of fat to bread increases its energy content significantly. Therefore, it is not clear how advantageous the improvements in glycaemia observed in the study at hand will actually be - after all, calories still count!

With that being said, the scientists' conclusion that "[t]he incorporation of fats during bread baking reduces GR, with the greatest attenuation seen in COC," is a significant result. One that can be partly explained by the reduction in carbohydrate digestibility via ALC formation, but not by any effects on the insulin response to the meal (if you fear insulin, adding fat is thus not going to cut it | learn more).

That the 'coconut advantage' is due to lauric acid and myristic acid in coconut oil is likely, but warrants further investigation; the same goes for the scientists' concluding remark that "[t]he use of simple dietary interventions (addition of functional lipids during cooking of carbohydrate-rich staple foods) may be an effective and practical strategy for improving glycaemic control, and may help in the prevention and management of [...T2DM] and CVD" (Lau. 2016) | Comment!.
References:
  • Clegg, Miriam E., et al. "Addition of different fats to a carbohydrate food: Impact on gastric emptying, glycaemic and satiety responses and comparison with in vitro digestion." Food Research International 48.1 (2012): 91-97.
  • Kaur, Kulwinder, and Narpinder Singh. "Amylose-lipid complex formation during cooking of rice flour." Food Chemistry 71.4 (2000): 511-517.
  • Lau, et al. "Effect of fat type in baked bread on amylose–lipid complex formation and glycaemic response." British Journal of Nutrition, Published online: 22 April 2016.

Jumat, 19 Februari 2016

High Dose Stevia Turns Weight Gain into Loss, Lowers Lipid and Glucose Levels not Only When Used to Replace Sugar - Effects are Mediated by Reduced Energy Intake & Utilization

There's very little "natural" about the natural sweetener stevia when it ends up in your food in form of purified and decolorized steviosids.
As a SuppVersity reader you'll know that "natural" does not equate "healthy". This, the proven anti-microbial effects stevia exerts in your gut and the fact that the currently available steviosid-based stevia products undergo more processing steps than than the dreaded aspartame warrant the question whether (a) stevia is safe and (b) as effective as other sweeteners when it comes to weight loss promotion.

Since the optimal dosage of stevia to achieve meaningful effects is also not known, yet, scientists from the Alexandria University in Egypt investigated the safety ad efficacy of different amounts of stevia sweeteners (25, 250, 500 and 1000 mg/kg body weight per day) as a substitute for sucrose on weight gain or the weight loss and weight management of female rats on an ad-libitum diet.
You can learn more about sweeteners at the SuppVersity

Aspartame & Your Microbiome - Not a Problem?

Will Artificial Sweeteners Spike Insulin?

Sweeteners & the Gut Microbiome Each is Diff.

Chronic Sweeten-er Intake Won't Effect Microbiome

Stevia, the Healthy Sweetener?

Sweeteners In- crease Sweet- ness Threshold
Sixty adult female Wistar strain rats (average weight 203 ± 6 g) were used in the present experiment. Animals were obtained from Faculty of Medicine, Alexandria University, Egypt. Animals were caged in groups of 6 and given distilled water and a standard diet that meets their requirements for growing ad libitum. The diet consisted of  44% soybean cake; 12% berseem clover hay, 13.5% fat, 9.8% yellow maize, 13.2% starch, 5% minerals; 2% lime stone and 0.5% vitamins mixture. After two weks of acclimatization, animals were divided into six equal groups:
  • The first group was drank distilled water (Negative control), and positive control was given a dose of sucrose dissolved in drinking water at 500 mg/kg/day. This dose of sucrose used in this experiment was predicted to dose of stevia sweeteners equivalent concentration estimated by JECFA as control. 
  • "On the other hand, groups 3, 4, 5 and 6 were given a different doses of stevia sweeteners which were dissolved in drinking water at a dose level of 25 mg/kg/day (human equivalent dosage, HED = 4 mg/kg/day) according to JECFA (G1), 250 mg/kg/day (G2: HED = 41 mg//kg/day), 500 mg/kg/day (G3: HED = 81 mg/kg/day) and 1000 mg/kg/day (G4: HED = 162 mg/kg/day ), respectively" (Elnaga. 2016)
To assess how much stevia the animals actually consumed, the scientists recorded the animals fluid intake daily. To ensure constant intakes in all groups, they adjusted the solution concentrations weekly based on the average weight of the animals and their current fluid consumption.
At the end of the experimental period (12 weeks), body weights of animals were recorded and calculated of body weights gain (%) and feed efficiency ratio (FER) according to the method of Chapman et al. (1959).
Figure 1: Body weight of rats treated with administration of sucrose (S) and stevia sweetener different dosages (25, 250, 500 and 1000 mg/kg) for 12 weeks compared with control (Elnaga. 2016).
You probably expected that the replacement of sugar with stevia would lead to significant reductions in body weight gain, right? Well, if you scrutinize the data in Figure 1, you will notice that the effect went far beyond a reduction in weight gain. In fact, all stevia supplemented animals lost weight - dose-dependently 40.29%-48.29%.
Figure 2: Organ weights relative to body weight of female rats treated with stevia sweetener at doses of 25, 250, 500 and 1000 mg/kg b. wt and sucrose compared with control (Elnaga. 2016).
This certainly sounds like bad news, but the data in Figure 2 tells you that the weight of all important organs (liver, heart, brain, kidney, lung, pancreas and spleen) remained stable. Unfortunately, the scientists did not measure muscle and fatpad weight.
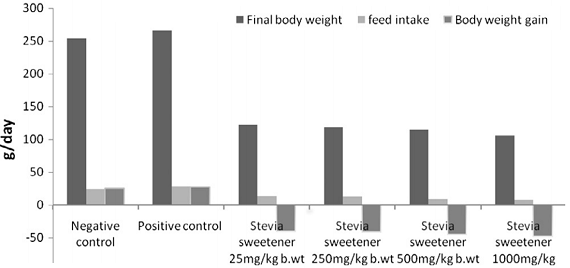
Figure 3: Final body weight, feed intake and body weight gain % in rats treated with administration of stevia sweetener in different dosages (25, 250, 500 and 1000 mg/kg) after 12 weeks on ad-libitum diet (Elnaga. 2016).
In view of the significantly reduced feed intake (>50%) and the even more reduced feed efficiency ratio (FER), of which the scientists say that it was the lowest at a dose 1000 mg/kg b.wt stevia ( -6.14) and increased with decreasing stevia intakes (-5.21, -3.22 FER and -2.91 FER), it would yet be unreasonable to assume that the weight difference was a results of fat loss, alone.
What about human studies? And what's the mechanism? Comparable human studies haven't been done and the fact that a 2005 study by Chang et al. suggests that the body weight loss of rats receiving 5.0 mg/kg stevioside was due to the poor palatability of the food because of the high amount of stevioside. It is thus questionable if stevia would work the same magic in humans. Ok, in the study at hand, the sweetener was gavaged in the drinking water, but the food intake still decreased significantly. Significantly enough to trigger profound weight loss even in the absence of the reduced feed efficacy (see Figure 3); and even the reductions in blood lipids and glucose could eventually be a function of weight loss - even though, studies appear to suggest that stevia has insulinotropic, glucagonostatic, antihyperglycemic, and blood-pressure-lowering effects all of which would suggest that it could be more than a sugar replacement (Gregersen. 2004; Hony. 2006).
Aside from the questionable weight loss, the three groups of rats treated with stevia sweetener showed improvement in lipid profile levels comparing with negative or positive control group. More specifically,
  • ... the total lipid levels of the rodents decreased by 11.96%, 19.89%, 25.03% and 37.07% when rats were given stevia sweetener at doses of 25, 250, 500 and 1000 mg/kg/b. wt, respectively compared to negative control,
  • ... the LDL values in rat serum lipids decreased with increasing the doses of stevia sweetener; rats given stevia sweetener at dose 1000 mg/kg b. wt showed the highest decrease in the LDL (26.50%) followed by those given dose 500 mg/kg (24.36%), dose 250 mg/kg (19.90%) and finally dose 25 mg/kg (15.01%), and 
  • ... the VLDL levels were decreased 3.13%, 11.18%, 19.87% and 26.08% in rats given stevia sweetener at doses of 25, 250, 500 and 1000 mg/kg.
The decreases in total, LDL and VLDL cholesterol stand in contrast to significant increase in HDL and corresponding decreases of the LDL/HDL ratio from 3.43 and 3.76 in the negative and positive control group to 2.90, 2.49, 2.30 and 2.18 in the 25mg/kg, 250mg/kg, 500mg/kg and 1000mg/kg groups, respectively.
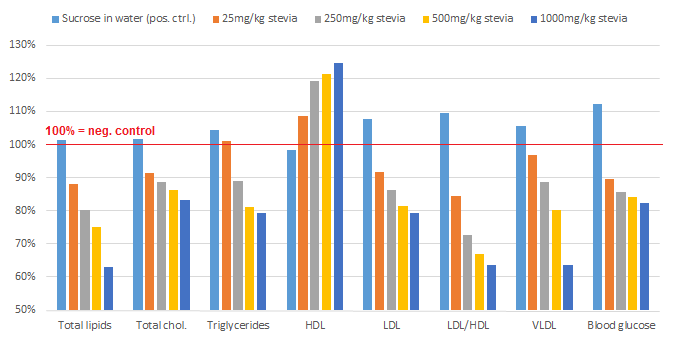
Figure 4: Blood lipids and glucose levels after 12 weeks on high sucrose water with different amounts of stevia replacing the sucrose in the water; data expressed relative to negative (=water) control (Elnaga. 2016).
Ill effects on markers of liver health or general blood parameters were not observed and the significant decrease in blood glucose levels, I added to the relative changes in lipid levels in Figure 4, is certainly nothing to be concerned about.
Bottom line: Just as the scientists put it, "the stevia sweetener treated groups showed significantly improvement and ameliorated reduction in bodyweight, BWG % and lesser intake of feed" (Elnaga. 2016). In conjunction with the "decreasing [...] levels of blood glucose, total lipids, total cholesterol, triglycerides and low-density lipoprotein concentrations, and increasing [...] high-density lipoprotein" (ibid.) concentrations the study at hand appears to suggest that stevia was a wonder-drug.

Study indicates stevia kills healthy gut bacteria. So, how bad is it? Are the effects significant, will they have an impact on your overall health and does this mean you must not use stevia any longer? Learn more in this SV Classic
Two things you must not forget, though, are that (a) the health benefits were most pronounced in comparison to the "positive control", i.e. the sucrose guzzling rats that represent the average sugar-sweetened beverage junkie and that (b) the >40% of weight the rodents lost certainly didn't come from body fat, exclusively.

In view of the contemporary lack of data that would confirm the beneficial effects of several grams of stevia (the dose equivalents for an adult are  ~0.2, ~1.6, ~3.2, ~6.5g per day, respectively) on the body composition and lipid levels of human beings, I must caution against being too euphoric about the results of this study, anyways. | Comment!
References:
  • Chang, J. C., et al. "Increase of insulin sensitivity by stevioside in fructose-rich chow-fed rats." Hormone and metabolic research= Hormon-und Stoffwechselforschung= Hormones et metabolisme 37.10 (2005): 610-616.
  • Elnaga, NIE Abo, et al. "Effect of stevia sweetener consumption as non-caloric sweetening on body weight gain and biochemical’s parameters in overweight female rats." Annals of Agricultural Sciences (2016).
  • Gregersen, Søren, et al. "Antihyperglycemic effects of stevioside in type 2 diabetic subjects." Metabolism 53.1 (2004): 73-76.
  • Hong, Jing, et al. "Stevioside counteracts the α-cell hypersecretion caused by long-term palmitate exposure." American Journal of Physiology-Endocrinology and Metabolism 290.3 (2006): E416-E422.

Sabtu, 30 Januari 2016

Sleep Science Update: New Insights into the Effect of a Lack of Quality Sleep on Glucose Control and Diabesity Risk

Blue light is not the only enemy of sleep, but it's the most prevalent one, today.
Personally, I believe that sleep, "a condition of body and mind which typically recurs for several hours every night, in which the nervous system is inactive, the eyes closed, the postural muscles relaxed, and consciousness practically suspended" (that's what Google's "define"-feature will tell you about sleep), is still an under-appreciated determinant of optimal health and performance.

Evidence to support this assertion comes from a series of studies that were presented at the Winter Meeting of the British Nutrition Society on December 8-9, 2015 - a meeting with the telling title: "Roles of sleep and circadian rhythms in the origin and nutritional management of obesity and metabolic disease" (O'Sullivan. 2015).
Learn more about the health effects of correct / messed up circadian rhythms

Sunlight, Bluelight, Backlight and Your Clock

Sunlight a La Carte: "Hack" Your Rhythm
Breaking the Fast to Synchronize the Clock

Fasting (Re-)Sets the Peripheral Clock

Vitamin A & Caffeine Set the Clock

Pre-Workout Supps Could Ruin Your Sleep
  • Circadian disruption in shift workers – the effects of insufficient sleep on dietary and lifestyle behaviours (Nea. 2016) - It will not surprise you that shift workers report more sleep problems compared to the general public. Studies estimate that 10–30 % of shift workers suffer from a circadian rhythm disorder known as “shift work disorder”(Gumenyuk. 2012). With their new quantitative study, a team of young researchers from the Dublin Institute of Technology and the University of Ulster provides some insights into the consequences of this problem.

    As the scientists point out, overall, just 34·3 % of the sample was achieving adequate sleep. A number of factors were associated with insufficient sleep – being male (p < 0·001), being 35–54 years of age (p < 0·001), having adult/child dependents (p < 0·001), working in larger organisations (p = 0·045), working in distribution/logistics, manufacturing or construction (p = 0·005), working night shifts (p = 0·042), and working longer shifts (p = 0·002).
    Factors that increased the subject's risk of not getting adequate sleep (Nea. 2016).
    Furthermore, the scientists observed that insufficient sleep had an effect on the diet of workers. Those who did not achieve adequate sleep were more likely to skip meals on working days and skipped meals significantly more frequently (p = 0·023).
    "Workers with insufficient sleep were also significantly less likely to consume the recommended 5 portions of fruit and vegetables per day (37·5 % vs 43·3 %, p = 0·045) and were less likely to consume the recommended 3 portions of milk/cheese/yoghurt per day (11·6 % vs 8·1 %, p = 0·050). In addition, those with insufficient sleep had higher prevalence of hypertension (10·2 % vs 5·7 %, p = 0·008) and depression/anxiety (7·3 % vs 3·4 %, p = 0·008)" (Nea. 2016)
    Participants were also questioned how they perceived shift work impacts on various aspects of their lives. Compared to those who achieve adequate sleep, those who had insufficient sleep were significantly more likely to report that shift work had a negative effect on their physical health (p < 0·001), mental health (p = 0·003), family life (p = 0·001), social life (p = 0·046), physical activity levels (p = 0·029) and overall quality of life (p = 0·002). Those with insufficient sleep were also significantly more likely to report that shift work increases how much alcohol they drink (p = 0·041).
  • Oral glucose tolerance test results are affected by prior sleep duration: a randomised control crossover trial of normoglycaemic adults (Ellison. 2016) - As Ellison et al. rightly point out, "[o]ral glucose tolerance tests (OGTTs) remain the key clinical tool for assessing glucose control and diagnosing diabetes" (Ellison. 2016). In that, they criticize that "[c]urrent guidelines for administering such tests emphasise the importance of a preceding 8 hour fast (often undertaken overnight) but overlook the potential role that preceding sleeping patterns night might play in glucose control the following day" (ibid.). In view of the number of recent observational and experimental studies, which suggest that poor sleep is associated with an increased risk of diabetes, these tests may very well be messed up by a lack of sleep during the previous 8h fast. The aim of the latest study by scientists from the Sound Asleep Laboratory in Leeds was therefore "to explore the effect of early vs. late bedtimes on OGTT results using a cross-over randomised controlled trial" (ibid.).

    To this ends, the authors recruited 40 normoglycemic adults who were, after they had been stratification by self-reported pre-existing sleep patterns (as assessed using the Pittsburgh Sleep Quality Index; PSQI), allocated to either a ‘short’ (2·00am-7·00am) then ‘long’ (10·00pm−7·00am), or a ‘long’ then ‘short’ sleep duration, on two consecutive nights.
    "On each occasion, objective measures of sleep were obtained using the ‘SleepMeister’ application on an iPhone 4, with additional subjective assessments of sleep provided by subsequent completion of a version of the PSQI adapted to generate self-reports of sleep during the preceding night (as opposed to the preceding month). On each of the mornings following ‘short’ or ‘long’ sleep, participants again completed the PSQI and underwent a two-hour 75 g oral glucose tolerance test (OGTT), with blood glucose readings taken at 0, +30, +60, +90 and +120 minutes thereafter using finger-prick tests. Data were analysed using STATA v12. Ethical approval was granted by the University of Leeds REC (Ref:HSLTLM12075)" (Ellison. 2016).
    As it was to be expected, both the ‘SleepMeister’ application and the PSQI recorded significantly later bedtimes (SleepMeister: −19·9; 95 %CI: −20·1,−19·7; PSQI: −19·9; 95 %CI: −20·1,−19·7) and significantly shorter sleep durations (decimal hours: ‘SleepMeister’: −3·8;95 %CI: −4·3,−3·4; PSQI: −3·4; 95 %CI: −3·9,−2·9) following a 2am (vs.10pm) bedtime (i.e. ‘short’ and ‘long’ sleep duration, respectively) - a fact, the scientists consider evidence "that levels of compliance were high" (ibid.).

    In spite of that, there was no significant effect of sleep duration on fasting blood glucose levels prior to the OGTT after adjustment for sleep duration sequence (i.e. ‘short’ then ‘long’ vs. ‘long’ then ‘short’) and a modest imbalance in gender between the two intervention sequence group.
    Figure 2: Normal response (=expected response in OGGT, not the actual response of the subjects, because the absolute values are not disclosed in the abstract and an FT is not yet available) vs. calculated response as a consquence of insufficient sleep (normal + difference, rel. difference above bars | Ellison. 2016).
    What did differ, though, were the glucose levels recorded after the ingestion of 75 g glucose, which were consistently higher following a ‘short’ as opposed to a ‘long’ sleep duration, as well as the levels recorded at +60 and +90 minutes, which were likewise significantly higher by 1·18 mmol/l (95 %CI: 0·43,1·92; p = 0·003) and 0·55 mmol/l (95 %CI: 0·05,1·06; p = 0·032), respectively. These results, the scientists say, "indicate that short sleep duration the night before results in an immediate elevation in blood glucose levels the following morning in normoglycaemic adults" (ibid.). That this is a problem, should be obvious, after all it may falsely classify healthy individuals as pre-diabetics. Therefore, "further standardisation of pre-OGTT sleep duration, similar to that for an overnight fast," (ibid.) appears warranted.
  • Less Sleep Duration and Poor Sleep Quality Lead to Obesity (Parvaneh. 2016) - In a recent cross-sectional study that was carried out to investigate the association of sleep deprivation and sleep quality with obesity, Malaysian scientists analyzed data from 225 Iranian adults (109 males and 116 females) aged 20–55 years.
    "Heart Questionnaire (SHHQ), International Physical Activity Questionnaire (IPAQ) and a 24-hour dietary recall were interview-administered to evaluate sleep pattern, physical activity and dietary intake of the subjects. Besides, anthropometric also were measured, then subjects were categorized into normal weight and over-weight/obese based on WHO (2000). Sleep duration and sleep quality were assessed based on 2 groups of normal weight and overweight/obese" (Parvaneh. 2016).
    The scientists' analysis of the data revealed that overweight/obese individuals have significantly shorter sleep duration (5·37 ± 1·1 hours) as compared to normal weight subjects (6·54 ± 1·06 hours).
    Figure 3: Overweight / obesity is linked to sign. sleep problems (Parvaneh. 2016).
    Sleep duration was yet not the parameter the scientists from the National University of Malaysia identified as a major risk factor for obesity - that was a poor sleep quality, which was associated with a 100% increased risk for being overweight or obese (OR: 2·0, 95 % CI: 1·18–3·37, p < 0·05). As a conclusion, the scientists state that "lower sleep quality and sleep duration increase the risk of being overweight and obese" and demand: "[S]trategies for the management of obesity should incorporate consideration on sleeping pattern" (Parvaneh. 2016). These strategies, by the way, may also help people keep their triglyceride levels in check. After all, another study that was presented at the same meeting of the Nutrition Society suggests that a high sleep efficiency shows a strong and negative correlation with triglycrides and another important marker of heart disease risk, the total cholesterol to HDL ratio (Al Khatib. 2016).
  • Is insulin resistance associated with light at night in healthy sleep deprived individuals? (AlBreiki. 2016) - The simple answer to this question is "Yes!". The more complex one is that a recent study that was designed to investigate the impact of light and/or endogenous melatonin on plasma hormones and metabolites prior to and after a set meal in healthy sleep deprived subjects found that bright blunts the release of melatonin and the effects of insulin on glucose disposal.

    In the study, seventeen healthy participants, 8 females (22·2 years (SD 2·59) BMI 23·62 kg/m2 (SD 2·3)) 9 males (22·8 years (SD 3·5) BMI 23·8 kg/m2 (SD 2·06)) were randomised to a two way cross over design protocol; dim light condition (<5lux) and bright light condition (>500lux), separated by at least seven days.
    Melatonin promotes female weight loss - Suggested Read: "Trying to Lose Fat & Get "Toned"? Taking 1-3 mg Melatonin Helps Women Lose 7% Body Fat, Gain 3.5% Lean Mass".
    "Each session started at 18:00 h and finished at 06:00 h the next day. All participants were sleep deprived and semi-recumbent throughout the session. An isocalorific breakfast was consumed at 08:00 h and lunch was timed to be 10 hours before the evening meal. Each participant consumed an evening meal (1066 Kcal, 38 g protein, 104 g CHO, 54 g fat, 7 g fibre) at an individualised time based on estimated melatonin onset. Plasma and saliva samples were collected at specific time intervals to assess glucose, insulin and melatonin levels" (AlBreiki. 2016).
    As previously stated, the bright light reduced the salivary levels of melatonin significantly (p = 0·005). What is more relevant to the research question, however is that it also increased the postprandial glucose and insulin levels significantly compared to dim lights (p = 0·02, p = 0·001) respectively.

    Figure 3: Effect of light intensity on melatonin levels and glucose response of 8 female and 9 male normal-weight normoglycemic subjects to standardized meal consumed at night (AlBreiki. 2016).
    For the scientists this result is not exactly surprising. They had expected that the melatonin release would be suppressed due to the light intensity; that the increase in insulin was not able to compensate for the light-induced increased glucose resistance, however, shows that the ill effects of a  'night-shift-esque' bright light exposure at night on glucose metabolism are more severe than previously thought.
Redeem your sleep dept, now!
Bottom line: Along with studies highlighting the importance of sufficient hours of quality sleep on glucose control in pregnancy (Alghamdi. 2016; Alnaja. 2016) and the "largest study to-date to demonstrate a strong inverse association between late-onset diabetes and poor sleep, even after adjustment for potential confounding factors" (Alfazaw. 2016), the previously discussed studies highlight that sleep hygiene' is as important for your health as "clean eating" (whatever that maybe) and a sufficient amount of light and intense physical activity | Comment on Facebook!
References:
  • AlBreiki, et al. "Is insulin resistance associated with light at night in healthy sleep deprived individuals?" Proceedings of the Nutrition Society, 75 (2016). 
  • Alfazaw, et al. "Variation in sleep is associated with diagnosis of late-onset diabetes: a cross-sectional analysis of self-reported data from the first wave of ‘Understanding Society’ (the UK Household Longitudinal Study)." Proceedings of the Nutrition Society, 75 (2016). 
  • Alghamdi, et al. "Short sleep duration is associated with an increased risk of gestational diabetes: Systematic review and meta-analysis." Proceedings of the Nutrition Society, 75 (2016). 
  • Alnaja, et al. "Relationship between sleep quality, sleep duration and glucose control in pregnant women with gestational diabetes." Proceedings of the Nutrition Society, 75 (2016). 
  • Al Khatib, et al. "The Sleep-E Study: An on-going cross-sectional study investigating associations of sleep quality and cardio-metabolic risk factors." Proceedings of the Nutrition Society, 75 (2016). 
  • DeFronzo, Ralph A. "The triumvirate: β-cell, muscle, liver. A collusion responsible for NIDDM." Diabetes 37.6 (1988): 667-687.
  • Ellison, et al. "Oral glucose tolerance test results are affected by prior sleep duration: a randomised control crossover trial of normoglycaemic adults." Proceedings of the Nutrition Society, 75 (2016). 
  • Gumenyuk, Valentina, Thomas Roth, and Christopher L. Drake. "Circadian phase, sleepiness, and light exposure assessment in night workers with and without shift work disorder." Chronobiology international 29.7 (2012): 928-936.
  • Nea et al. "Circadian disruption in shift workers – the effects of insufficient sleep on dietary and lifestyle behaviours." Proceedings of the Nutrition Society, 75 (2016). 
  • O’Sullivan (ed.). "Roles of sleep and circadian rhythms in the origin and nutritional management of obesity and metabolic disease." Proceedings of the Nutrition Society. Volume 75 / Issue OCE1 - Winter Meeting, 8–9 December 2015. Published January 2016: E1-E42.
  • Parvaneh, et al. "Less Sleep Duration and Poor Sleep Quality Lead to Obesity." Proceedings of the Nutrition Society, 75 (2016). 
  • Peschke, Elmar. "Melatonin, endocrine pancreas and diabetes." Journal of pineal research 44.1 (2008): 26-40.

Jumat, 11 Desember 2015

Cinnamon as Nutrient Partitioner and 1st-Line Treatment for Pre-Diabetes? 5% Decrease in Fasting Glucose per Month in Human Studies, Up to 24% in 40 Days W/ High(er) Doses

Yes, that's how real cinnamon look like. It does not grow as powder in plastic boxes on trees as I suspect the members of the generation McBurgerSubway believe ;-)
No, this is not absolutely new. In fact this is just "another" SuppVersity articles on the anti-diabetic effects of cinnamon, but I promise it's going to be the most comprehensive one. One that discusses the currently available evidence from human trials, as well as the things we know and believe to know about how cinnamon acts its anti-diabetic magic qualitatively and quantitatively.

Before I even go into further details, though, I would like to address one of the "cinnamon myths" that says that only the highly expensive Ceylon or Sri Lankan Cinnamon would do the trick, while the commonly sold Cinamon cassia would be useless or even dangerous due to its high (and in fact toxic) coumarin content.
Trying to improve your blood glucose management? Learn how at the SuppVersity

Proteins, Peptides & Blood Glucose

Diff. Fats & Blood Glucose

Read these ➲ while waiting

Spread or waste your protein?

Protein requ. of athletes

High EAA intra-workout fat loss
Interestingly, all human studies have been done with the "cheap toxic stuff from the supermarket". In view of what you are about to learn about its effects on blood glucose later in this article, the first take-home-message from today's article is thus: "Cheap cinnamon cassia will work just fine as a blood glucose management supplement!" Unfortunately, long-term studies the safety of "common cinnamon" with its highly variable coumarin content (0.31 g = harmless to 6.97 g = potentially dangerous per kg raw powder | Wang. 2013 | see Table 1) are non-existent.

Table 1: Content of Coumarin 1, Cinnamyl Alcohol 2, Cinnamaldehyde 3, Cinnamic Acid 4, Eugenol 5, Cinnamyl Acetate 6 in Cinnamomum Species and Commercial Samples (g/kg) | DUL = Detected under limits of quantitation; ND = not detected (Wang. 2013).
The only advise I can give you is thus to rely on supplements with standardized (low to non-detectable) amounts of this potentially carcinogenic substance (Wang. 2014) if you plan to take it regularly for years. Using the next best cinnamon powder from the supermarket next door on the other hand is probably not advisable even though some of the scientists who conducted the studies Arjuna B. Medagama reviewed for his (or her?) latest paper in Nutrition Journal (Medagama. 2015) probably did just that: Buy cinnamon powder from the supermarket next door to test its effects on blood glucose management in 40-days- to 4-months-studies in cinnamon-naive patients with (pre-)diabetes.

If you take a closer look at the data, though, it becomes obvious that some studies used plain cinnamon powder, while others used regular or commercial water-extracts (CinSulin. Anderson).
Effect of 6g of cinnamon on post-prandial blood glucose in healthy subjects (Hlebowicz. 2007). This hefty dose also slowed down gastric emptying and triggered non-significant increases in satiety in 14 healthy subjects after high CHO meals.
What's the optimal dosage? Even though the overview in Figure 1 suggests that "more helps more", Anand, et al. (2010) observed negative effects on the liver of rodents at dosages that would tantamount to ~40g of cinnamon per day. Ok, I assume you already apprehended that this is madness, but in the world of fitness maniacs and mad bodybuilders I thought it would be worth mentioning that even the coumarin free Ceylon cinnamon appears to have ill side effects when it is consumed in extremely high dosages. It would thus appear to be more reasonable to target an intake of 3-6 g of cinnamon with every major meal (it slows down gastric emptying and reduces postprandial blood glucose, therefore it makes sense to take it with a meal | Hlebowicz. 2007, see Figure to the left).
If you scrutinize the results I've plotted for you in Figure 1, you will notice that (a) the improvements in fasting blood glucose were significantly more pronounced than those of the long-term blood sugar maker HbA1c, that (b) the former appear to increase with the dosage that was used (Klan and Mang observed the highest reductions and used the highest amounts of cinnamon powder), and that (c) the reductions in HbA1c take time, i.e. several months and are not guaranteed, even if there are significant reductions in fasting blood glucose (cf. Belvins).

Figure 1: Relative changes in fasting blood glucose and HbA1c levels of pre-diabetic subjects (Medagama. 2015)
On average, the fasting blood glucose levels of the study participants in all studies decreased by 4.7% in four weeks; the HbA1c, on the other hand, by only 1%. Since part of the effects on blood glucose are merely a results of the reduced gastric emptying and will thus affect the peak values, yet not the overall glycemia, it appears logical that the HbA1c reacts slowly to the intervention. As Medagama points out, the effects of cinnamon are yet more far-reaching, so that more pronounced effects on the slow-reacting HbA1c levels can be expected to be seen in the hitherto non-existent long-term (= 1-2 year) studies, because cinnamon will also have ...
  • Figure 2: Molecular mechanisms of Cinnamon by which it exerts hypoglycaemic activity. (Medagama. 2015).
    direct effects on the insulin receptor have been observed for Cinnamtannin B1, a proanthocyanidin isolated from the stem bark of Ceylon cinnamon that activates the phosphorylation of the insulin receptor β-subunit on adipocytes as well as other insulin receptors,
  • indirect effects on glucose management that are mediated by increased GLP-1 levels, a satiety hormone that decreases the amount of insulin that is necessary to clear glucose from your blood - as Medagama points out, probably by improving glucose transport,
  • direct effects on the GLUT-4 glucose uptake receptor, the expression of which is increased by 42.8 % to 73.1 % in brown adipose tissue and muscle by cinnamon in a dose dependent manner,
  • indirect effects on insulin sensitivity that are mediated by the effects of cinnamon on the expression of PPAR (α) and PPAR (γ), the increase of which is linked to increased glucose uptake - unfortunately, also in fat cells,
  • direct effects on carbohydrate availability that are mediated by the inhibition of the amylase enzyme that is responsible for breaking down complex carbs into simple sugars,
  • indirect effects on the endogenous production of glucose in the liver that is inhibited by cinnamon (glucogenesis, i.e. the storage of sugar in the liver, on the other hand, is promoted), and
  • indirect effects that are brought about by the reduced rate of gastric emptying that will naturally slow down the absorption of glucose after a meal.
If that was too much for you to remember, I guess the graphical overview Medagama created may serve as a memory aid, when you come back to this article to refresh your knowledge about cinnamon and pre-diabetes. Speaking of which...
Glucose Control Beyond Carb Reduction ➲ Amino Acids, Proteins, Peptides | learn more!
So, what's the verdict about cinnamon and pre-diabetes? As Medagama points out in the conclusion to the previously referenced recently published review, "[b]oth true cinnamon and cassia cinnamon has the potential to lower blood glucose in animal models and humans" (Medagama. 2015). The problem is yet that we do not have reliable long-term safety studies for both, the problematic, potentially coumarin-laden regular cinnamon, as well as the expensive 99% coumarin-free Ceylon cinnamon, which has actually never been tested in human studies (rodent studies suggest that it works at least as well, though).

Addendum: As previously hinted at, there is no evidence from human studies that the "healthier", "true cinnamon" aka Ceylon cinnamon even works. Well, I just noticed that there's a single, rarely cited study in healthy individuals from the Lund University in Sweden that says that Ceylon cinammon has no effect whatsoever on glycemia and thus concludes "The Federal Institute for Risk Assessment in Europe has suggested the replacement of C. cassia by C. zeylanicum or the use of aqueous extracts of C. cassia to lower coumarin exposure. However, the positive effects seen with C. cassia in subjects w/ poor glycaemic control would then be lost." (Wickenberg. 2012)

To recommend regular cinnamon as a standard-supplement, you'd take everyday for years, on the other hand cannot really be recommended - not for pre-diabetics and by no means for healthy, active individuals who have no reason to take supplements with non-muscle specific glucose partitioning effects, anyways. If you want to improve your glucose management folks, work out - a glycogen-depleting strength or HIIT workout, that's the only scientifically proven muscle specific glucose repartitioner | Comment on Facebook!
References:
  • Akilen, R., et al. "Glycated haemoglobin and blood pressure‐lowering effect of cinnamon in multi‐ethnic Type 2 diabetic patients in the UK: a randomized, placebo‐controlled, double‐blind clinical trial." Diabetic Medicine 27.10 (2010): 1159-1167.
  • Anand, Prachi, et al. "Insulinotropic effect of cinnamaldehyde on transcriptional regulation of pyruvate kinase, phosphoenolpyruvate carboxykinase, and GLUT4 translocation in experimental diabetic rats." Chemico-biological interactions 186.1 (2010): 72-81.
  • Anderson, Richard A., et al. "Cinnamon extract lowers glucose, insulin and cholesterol in people with elevated serum glucose." Journal of Traditional and Complementary Medicine (2015).
  • Blevins, Steve M., et al. "Effect of cinnamon on glucose and lipid levels in Non–insulin-dependent type 2 diabetes." Diabetes care 30.9 (2007): 2236-2237.
  • Crawford, Paul. "Effectiveness of cinnamon for lowering hemoglobin A1C in patients with type 2 diabetes: a randomized, controlled trial." The Journal of the American Board of Family Medicine 22.5 (2009): 507-512.
  • Hlebowicz, Joanna, et al. "Effect of cinnamon on postprandial blood glucose, gastric emptying, and satiety in healthy subjects." The American journal of clinical nutrition 85.6 (2007): 1552-1556.
  • Khan, Alam, et al. "Cinnamon improves glucose and lipids of people with type 2 diabetes." Diabetes care 26.12 (2003): 3215-3218.
  • Mang, B., et al. "Effects of a cinnamon extract on plasma glucose, HbA1c, and serum lipids in diabetes mellitus type 2." European journal of clinical investigation 36.5 (2006): 340-344.
  • Suppapitiporn, Suchat, and Nuttapol Kanpaksi. "The effect of cinnamon cassia powder in type 2 diabetes mellitus." Journal of the Medical Association of Thailand= Chotmaihet thangphaet 89 (2006): S200-5.
  • Vanschoonbeek, Kristof, et al. "Cinnamon supplementation does not improve glycemic control in postmenopausal type 2 diabetes patients." The Journal of nutrition 136.4 (2006): 977-980.
  • Wang, Yan-Hong, et al. "Cassia cinnamon as a source of coumarin in cinnamon-flavored food and food supplements in the United States." Journal of agricultural and food chemistry 61.18 (2013): 4470-4476.
  • Wickenberg, Jennie, et al. "Ceylon cinnamon does not affect postprandial plasma glucose or insulin in subjects with impaired glucose tolerance." British journal of nutrition 107.12 (2012): 1845-1849.